CodeChecker Usage Guide
This document describes the basic steps how the CodeChecker tool should be used to find errors in your source code and integrate the static analysis into your CI flow to prevent new errors.
Table of Contents
- CodeChecker Usage Guide
- Table of Contents
- Preface
- Step 0: Setup CodeChecker environment
- Step 1: Integrate CodeChecker into your build system
- Step 2: Analyze your code
- Step 3: View analysis results in command line or generate static HTML files
- Step 4: Incremental Analysis
- Step 5: Cross Translation Unit Analysis
- Step 6: Store analysis results in a CodeChecker DB and visualize results
- Step 7: Fine tune Analysis configuration
- Step 8: Integrate CodeChecker into your CI loop
- Updating CodeChecker to new version
- Unique Report Identifier (RI)
- Listing and Counting Reports
- Report Uniqueing
- How diffs between runs are calculated?
Preface
The purpose of this document is to make the developer's first steps easier in usage of CodeChecker. The document is a mini course with simple examples that guides the developer how he/she can apply CodeChecker in his/her daily routine to make his/her code more robust.
There is a simple example program in this repository what will be used in the later sections to show CodeChecker usage.
Step 0: Setup CodeChecker environment
There are some prerequisite to successfully take this example:
- Install CodeChecker.
- Install analyzer binaries:
clang/clang-tidy(on debian based systems update-alternatives is your friend). - Install
gccandmaketo compile our example project. - Install Python 3 (>= 3.9)
Step 1: Integrate CodeChecker into your build system
CodeChecker analyzes sources and dependencies that are built by your build system.
Step in the docs/examples directory
cd <repo root dir>/docs/examples
Clean the workspace
make clean
Log your build
Logging means that during the whole compilation process CodeChecker catches compiler calls and saves commands in a compilation database file. This compilation database is an input of the next analysis step.
note: This command is currently not working on macOS.
The System Integrity Protection (SIP) in macOS blocks the usage of LD_LIBRARY_PATH.
Please try to obtain the compile_commands.json in an other way, with the help of CMake for example.
CodeChecker log --build "make" --output ./compile_commands.json
Check the contents of compile_commands.json file
If everything goes well it should contain the C compiler calls (gcc, clang,
etc.).
cat ./compile_commands.json
What to do if the compile_commands.json is empty?
In this case a debug log file is generated beside the compile_commands.json
(named codechecker.logger.debug) and if the compilation database is empty maybe
it will contain much information about this.
- Make sure that your build system actually invoked the compiler (e.g.
gcc,g++,clang). In case your software was built once (and the binaries are already generated), the compiler will not be invoked. In this case do a build cleanup (e.g.make clean) and retry to log your build. - Make sure that the
CC_LOGGER_GCC_LIKEenvironment variable is set correctly and contains your compilers. For detailed description see the user guide. - MacOS users need
intercept-buildto be available on the system, and in most cases, System Integrity Protection needs to be turned off. See the README for details.
Step 2: Analyze your code
Once the build is logged successfully and the compile_commands.json was
created, you can analyze your project.
Run the analysis
CodeChecker analyze ./compile_commands.json --enable sensitive --output ./reports
However the compilation of the project (here the example program) is performed
by gcc, the CodeChecker uses clang to analyze sources of the project.
During analysis, CodeChecker compiles/analyses sources again. The analysis
process generally uses more time. If you want to speed up analysis specify a
higher value for the --jobs option.
The input of the analysis can be either a compilation database JSON file like
in the example above or a source file or a project/module directory. In all
cases the analysis relies on the compilation database, but with a file/directory
input the compile_commands.json is searched automatically by CodeChecker in
the parent directories:
CodeChecker analyze my_source_file.cpp
CodeChecker analyze project_dir
CodeChecker analyze project_dir/sub_module_dir
In the above command the --enable sensitive means that a subset of checker
are run. sensitive chooses a predefined "group" of checkers. For further
info on available checkers use these commands:
# List available checkers.
CodeChecker checkers --help
# Show more information about the checkers.
CodeChecker checkers --details
# List profiles.
CodeChecker checkers --profile --details
# List checkers which are in the sensitive profile.
CodeChecker checkers --profile sensitive --details
The ./reports directory is the "database" of CodeChecker that allows to
manage further working steps.
View the analysis results in the command line
CodeChecker parse ./reports
Hint:
You can do the 1st and the 2nd step in one round by executing check
cd <repo root dir>/docs/examples
make clean
CodeChecker check --build "make" --output ./reports --clean \
    --enable sensitive
or to run on 22 threads both the compilation and the analysis:
CodeChecker check --jobs 22 --build "make clean ; make --jobs 22" \
    --output ./reports --clean --enable sensitive
Cross-Compilation
Cross-compilers are auto-detected by CodeChecker, so the --target and the
compiler pre-configured include paths of gcc/g++ are automatically passed to
clang when analyzing.
Make sure that the compilers used for building the project (e.g.
/usr/bin/gcc) are accessible when CodeChecker analyze or check is
invoked.
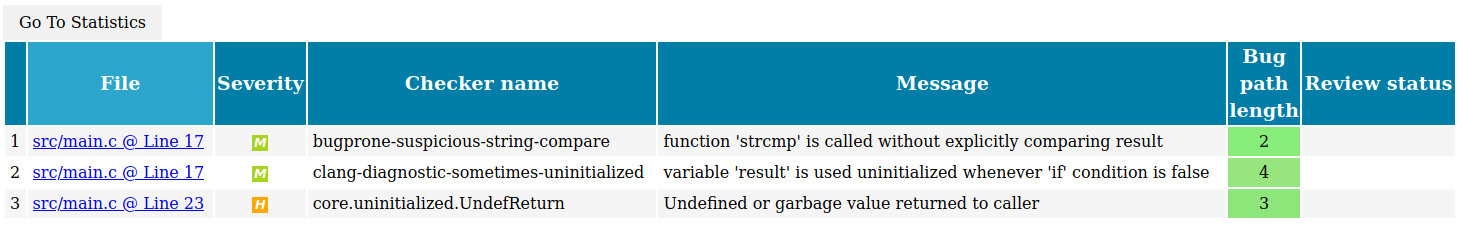
Step 3: View analysis results in command line or generate static HTML files
You can print detailed results (including the control flow) in command line by running:
CodeChecker parse --print-steps ./reports
...
Found no defects in divide.c
[MEDIUM] src/main.c:17:9: function 'strcmp' is called without explicitly comparing result [bugprone-suspicious-string-compare]
    if (strcmp(argv[1], "all")) {
        ^
  Report hash: c60704d2b3d5069c975c269a0cbd03c7
  Steps:
    1, main.c:17:32: != 0 (fixit)
    2, main.c:17:9: function 'strcmp' is called without explicitly comparing result

[MEDIUM] src/main.c:17:9: variable 'result' is used uninitialized whenever 'if' condition is false [clang-diagnostic-sometimes-uninitialized]
    if (strcmp(argv[1], "all")) {
        ^
  Report hash: 21f2edcb80d0c1eb26bc1afc0eaf5e61
  Steps:
    1, main.c:23:17: uninitialized use occurs here
    2, main.c:17:5: remove the 'if' if its condition is always true
    3, main.c:10:16: initialize the variable 'result' to silence this warning
    4, main.c:17:9: variable 'result' is used uninitialized whenever 'if' condition is false

[HIGH] src/main.c:23:5: Undefined or garbage value returned to caller [core.uninitialized.UndefReturn]
    return (int)result;
    ^
  Report hash: 5285af5a69bbc12ba9ab306bbcda643c
  Steps:
    1, main.c:10:5: 'result' declared without an initial value
    2, main.c:17:9: Assuming the condition is false
    3, main.c:23:5: Undefined or garbage value returned to caller

Found 3 defect(s) in main.c
...
It is possible to generate reports as plain HTML files using the
CodeChecker parse command. (For other output formats please consult with help
of parse subcommand.)
CodeChecker parse --export html --output ./reports_html ./reports
To view the results in a browser run:
firefox ./reports_html/index.html &
./reports_html directory will contain an index.html with a link to all
findings that are stored in separate HTML files.
Step 4: Incremental Analysis
The analysis can be run for only the changed files and the report-directory
will be correctly updated with the new results.
There are two supported ways for incremental analysis.
a) In case you can build your project incrementally, you can build, log and analyze only the changed files and all the files that are depending on the source code changes (in case of the update of a header file).
b) If you only want to re-analyze changed source files, without re-building your project, you can use skip list to tell CodeChecker which files to analyze.
Automatic fixing
Some CodeChecker reports are so easy to fix that even static analyzer tools may
provide automatic fixes on them. In CodeChecker you can list these with the
following command after having analysis reports in reports directory:
CodeChecker fixit ./reports
In this section we will fix only one issue automatically. It changes the source
and you can try the incremental build feature on the modified source at that
described in the next section. The next command fixes issues found by the
bugprone-suspicious-string-compare checker in our example files.
CodeChecker fixit --checker-name bugprone-suspicious-string-compare --apply \
    ./reports
Without --apply option CodeChecker will not modify the source.
See --help on details of filtering automatic fixes.
Using incremental build on modified files
At this point you have only one modified file. The next command re-analyzes the
just modified main.cpp:
CodeChecker check --build "make" --output ./reports --enable sensitive
Since the make command only re-compiles the changed main.cpp
that file will be re-analyzed only.
Now reports directory contains also the results of the updated main.cpp.
Check the number of issues by re-generate html report as you did in Step 3.
Using skip file to narrow analyzed files
If you want to re-analyze only the changed source files without build, you can give a skip-list to CodeChecker.
Let's assume that only main.cpp that needs to be re-analyzed.
You need to create the following skip list file that tells CodeChecker to
analyze main.cpp and ignore the rest.
#skip.list:

+*main.cpp
-*
If you run the commands in the previous section then content of ./reports are
changed and main.cpp also changed. Revert back the filesystem to the original
state:
git checkout main.cpp
rm -rf ./reports
make clean
The compile_commands.jsonare the same. Then re-do the "development cycle".
CodeChecker check --build "make" --output ./reports  --enable sensitive
CodeChecker fixit --checker-name bugprone-suspicious-string-compare \
    --apply  ./reports
CodeChecker check --ignore skip.list --output ./reports --enable sensitive \
    --logfile ./compile_commands.json
For more details regarding the skip file format see the user guide.
Analyze explicitly selected source files from the compilation database
You can select which files you would like to analyze from the compilation database. This is similar to the skip list feature but can be easier to quickly analyze only a few files not the whole compilation database.
Undo filesystem modifications as described in the
previous section. Re-do analyze and perform automatic fix. The
following command re-analyzes only the main.cpp file.
CodeChecker check --output ./reports --file "*/src/main.c" \
    --enable sensitive --logfile ./compile_commands.json
Absolute directory paths should start with /, relative directory paths should
start with * and it can contain path glob pattern. Example:
/path/to/main.cpp, lib/*.cpp, */test*.
Step 5: Cross Translation Unit Analysis
The previous analysis did not consider dependencies between translation units.
To enable a Cross Translation Unit (CTU) analysis, add the --ctu option
to the analyze command. In addition, choose another "report-directory", for
example ./reports-ctu, to be able to compare the output of different analyses.
CodeChecker analyze ./compile_commands.json --output ./reports-ctu \
    --enable sensitive --ctu
Parse the output of the CTU analysis to check for newly detected issues.
CodeChecker parse --print-steps ./reports-ctu
The example code has another bug!
[HIGH] .../docs/examples/src/divide.c:5:22: Division by zero [core.DivideZero]
    return numerator / denominator;
                     ^
  Report hash: 0865bada8cc2c49d99f981d8c6484bd7
  Steps:
    1, main.c:17:44: Passing the value 0 via 2nd parameter 'denominator'
    2, main.c:17:26: Calling 'divide'
    3, divide.c:3:1: Entered call from 'main'
    4, divide.c:5:22: Division by zero

Found 1 defect(s) in divide.c
Step 6: Store analysis results in a CodeChecker DB and visualize results
You can store the analysis results in a central database and view the results in a web viewer:
- Start the CodeChecker server locally on port 8555 (using SQLite DB, which is not recommended for multi-user central deployment) create a workspace directory, where the database will be stored.
Note: Use a new shell.
cd <repo root dir>
CodeChecker server --workspace ./ws --port 8555
A default product called Default will be automatically created where you can
store your results.
- Store the results in the server under name "example" (in the
Defaultproduct):
CodeChecker store ./reports-ctu --name example \
    --url http://localhost:8555/Default
The URL is in PRODUCT_URL format:
[http[s]://]host:port/ProductEndpoint
Please note that if you start the server in secure mode (with SSL) you will
need to use the https protocol prefix. The default protocol is http.
See user guide for detailed
description of the PRODUCT_URL format.
- View the results in your web browser
firefox http://localhost:8555/Default &
Storage of multiple analysis report directories
It is possible that the same project is analyzed with different configurations
(e.g.: ctu, non-ctu) to different report directories and you would like to
store these results to the same run. Using multiple store commands is not an
option because reports which are already on the server but can't be found
during the second storage will be marked as Resolved.
To solve this problem you can store multiple report directories to the same run with one command:
CodeChecker store \
  ./reports-ctu \
  ./reports-nonctu \
  --name example \
  --url http://localhost:8555/Default
Definition of "run"
A "run" is a single execution of an analysis on a given version of the software. A run can contain the result of multiple analyzers (e.g. clang-tidy, clang static analyzer, cppcheck, etc.).
You can follow up the quality status of your product by storing the analysis results of consecutive git commits of a git branch into the same run. In this case, you will be able to follow-up the outstanding results and fixed reports in the statistics views. ( See your first example run)
So a run represents the analysis status of a single branch of your code, with a
given analysis configuration. You can also record the source code version
associated with the analysis with the --tag parameter.
Make sure, that you use the same analysis configuration when updating a run, because a changed analysis configuration can make new reports to appear or reports to disappear.
Programmer checking new bugs in the code after local edit (and compare it to a central database)
Say that you made some local changes in your code (automatically fixing example program) and you wonder whether you fixed any bugs. Each bug has a unique hash identifier that is independent of the line number, therefore resistant to shifts in the source code. This way, newly introduced bugs can be detected, compared to a central CodeChecker report database.
If you stored the first analysis of the unmodified example project and made automatic fixing then you can compare the result between stored and locally analyzed example project.
CodeChecker analyze ./compile_commands.json --output ./reports \
    --enable sensitive
CodeChecker store ./reports --name example --url http://localhost:8555/Default
CodeChecker fixit --checker-name bugprone-suspicious-string-compare --apply \
    ./reports
- Re-analyze your code. You are
well advised to use the same
analyzeoptions as you did in the first analysis session: the same checkers enabled, the same analyzer options, etc.
CodeChecker analyze ./compile_commands.json --output ./reports \
    --enable sensitive
- Compare your local analysis to the central one
CodeChecker cmd diff --basename example --newname ./reports --resolved \
    --url http://localhost:8555/Default
Using diff command on the local filesystem
Developer can compare two results of analyses without upload them to a central server. In this case the analysis result should be stored in different result directory.
CodeChecker cmd diff --basename ./reports --newname ./reports-ctu --new
You can also use JSON format output of CodeChecker cmd diff command if you
want to use it for further processing by an other program.
For further details check this section about the computation method of diff functionality.
Step 7: Fine tune Analysis configuration
Analysis Failures
The reports/failed folder contains all build-actions that were failed to
analyze. For these the clang tidy generates reports, clang static analyzer
will not.
Generally speaking, if a project can be compiled with Clang then the analysis should be successful always. We support analysis for those projects which are built only with GCC, but there are some limitations.
Possible reasons for failed analysis:
- The original GCC compiler options were not recognized by Clang.
- There are included headers for GCC features which are not supported by Clang.
- Clang was more strict when parsing the C/C++ code than the original compiler
(GCC). Any non-standard compliant or GCC specific code needs to be removed to
successfully analyze the file. One other solution may be to use the
__clang_analyzer__macro. When the static analyzer is using clang to parse source files, it implicitly defines the preprocessor macro clang_analyzer. One can use this macro to selectively exclude code the analyzer examines. - Clang crashed during the analysis.
Avoiding or Suppressing False positives
Sometimes the analyzer reports correct code as incorrect. These findings are called false positives. Having a false positive indicates that the analyzer does not understand some properties of the code.
CodeChecker provides two ways to get rid off false positives.
-
The first and the preferred way is to make your code understood by the analyzer. E.g. by adding
asserts to your code, analyze indebugbuild mode and annotate your function parameters. For details please read the False Positives Guide. -
If step 1) does not help, use CodeChecker provided in-code-suppression to mark false positives in the source code. This way the suppression information is kept close to the suspicious line of code. Although it is possible, it is not recommended to suppress false positives on the Web UI only, because this way the suppression will be stored in a database that is unrelated to the source code.
It is also possible to suppress multiple reports located in a specific folder or reported by a given checker. For further details see this guide.
Ignore modules from your analysis
You can ignore analysis results for certain files for example 3rd party
modules. For that use the --ignore parameter of the analyze command:
 -i SKIPFILE, --ignore SKIPFILE, --skip SKIPFILE
                        Path to the Skipfile dictating which project files
                        should be omitted from analysis. Please consult the
                        User guide on how a Skipfile should be laid out.
For the skip file format see the user guide.
CodeChecker analyze --build "make" --ignore ./skip.file --output ./reports
Enable/Disable Checkers
You can list the checkers using the following command
CodeChecker checkers --details
Every supported checker is reported by the checkers command and all of its
subcommands.
You may want to enable more checkers or disable some of them using the --enable, --disable switches of the analyze command.
For example to enable alpha checkers additionally to the previously used:
CodeChecker analyze ./compile_commands.json --output ./reports-alpha \
    --enable sensitive --enable alpha
Then:
CodeChecker cmd diff --basename ./reports --newname ./reports-alpha --new
shows a new issue in the example project.
Configure Checkers
See Configure Clang Static Analyzer and checkers documentation for a detailed description.
Identify files that failed analysis
After execution of
CodeChecker analyze ./compile_commands.json --output ./reports
the failed analysis output is collected into ./reports/failed directory.
This means that analysis of these files failed and there is no Clang Static Analyzer output for these compilation commands.
There is .zip file for each failed analysis
<source_file_name>_<analyzer>_<unique_compile_command_id>.plist_compile_error.zip
The zip file has the following internal structure
.
├── analyzer-command #the failing analysis command
├── build-action #the original compilation command
├── compilation_database.json #compliation database part of the failing analysis
├── compiler_info.json #configuration of the original compiler used
├── return-code #return code of the anlaysis command
├── sources-root #all source files needed to reproduce the analysis
├── stderr # standard error output of the analysis
└── stdout # standard outpout of the analysis
The analysis may have failed due to the following reasons:
* C/C++ standard non-compliance. Clang requires more strict compliance to the C/C++ standard than gcc. Please review your source code for any indicated non-compliances. Check the stderr and stdout files to find more information about the details of the error.
* CodeChecker compiler argument transformation error. If the original compilation command can be executed successfully (see the analyzer-command file), but the analysis fails for example with header inclusion errors, there is a chance that CodeChecker incorrectly transformed the original gcc/clang compiler invocation to analyzer invocation. Please report a bug to the CodeChecker developers and attach the failed.zip for easy reproduction.
* The analyzer crashed. This is an analyzer fault and a bug should be reported to the analyzer developers and attach the failed.zip for easy reproduction.
Step 8: Integrate CodeChecker into your CI loop
This section describes a recommended way on how CodeChecker is designed to be used in a CI environment to:
- Generate daily report summaries
- Implement CI guard to prevent the introduction of new bugs into the codebase
In CodeChecker each bug has a unique hash identifier that is independent of the exact line number therefore resistant to shifts in the source code. With this feature CodeChecker can recognize the same and new bugs in two different version of the same source file.
In summary:
- Create a single run for each module in each branch and keep it up to date with code changes (commits). The CI loop then can compare pull requests (commit attempts) against this run and list new bugs in the changed code. Programmers can also compare their local edits to this run to see if they would introduce any new issues.
- Store daily runs of a module every day in a new run post-fixed with date.
- You can query new and resolved bugs using the
cmd diffor the Web GUI. - Programmers should use in-code-suppression to tell the CI guard that a report is false positive and should be ignored. This way your suppressions remain also resistant to eventual changes of the bug hash (generated by clang).
Storing & Updating runs
Let us assume that you want to analyze your code-base daily and would like to send out an email summary about any newly introduced and resolved issues.
You have two alternatives:
- Store the results of each commit in the same run (performance efficient way)
- Store each analysis in a new run
Alternative 1 (RECOMMENDED): Store the results of each commit in the same run
Let us assume that at each commit you would like to keep your analysis results up-to-date and send an alert email to the programmer if a new bug is introduced in a "pull request", and if there is a new bug in the to-be-committed code, reject this "pull request".
A single run should be used to store the analysis results of module on a
specific branch: <module_name>_<branch>.
The run should be always updated when a new commit is merged to reflect the analysis status of the latest code version on your branch.
Let's assume that user john_doe changed tmux/attributes.c in tmux. The CI
loop reanalyzes tmux project and sends an email with reject if new bug was
found compared to the master version, or accepts and merges the commit if no
new bugs were found.
Let's assume that the working directory is tmux under the CI job's
workspace, that has the source code with John Doe's modifications checked
out.
- Generate a new log file for the new code
CodeChecker log --build "make" --output compile_commands.json
- Re-analyze the changed code of John Doe. If your "master" CI job
CodeChecker analyze ./compile_commands.json --output ./reports-PR
- Check for new bugs in the run
CodeChecker cmd diff --basename tmux_master --newname ./reports-PR --new \
    --url http://localhost:8555/Default
If new bugs were found, reject the commit and send an email with the new bugs to John.
If no new bugs were found:
-
Merge the changes into the master branch
-
Update the analysis results according to the new code version:
CodeChecker store ./reports-john-doe --url http://localhost:8555/Default --name tmux_master
If John finds a false positive report in his code and so the CI loop would
prevent the merge of his pull request, he can suppress the false positive by
amending the following suppression comment in his code a line above the bug or
add assertions or annotations so that the false positive reports are
avoided (see False Positives Guide).
An example, as follows:
int x = 1;
int y;

if (x)
  y = 0;

// codechecker_suppress [core.NullDereference] suppress all checker results
int z = x / y; // warn
See User guide for more information on the exact syntax.
Please find a Shell Script that can be used in a Jenkins or any other CI engine to report new bugs.
Alternative 2: Store each analysis in a new run
Each daily analysis should be stored as a new run name, for example using the
following naming convention: <module_name>_<branch_name>_<date>.
Using tmux with daily analysis as example:
- Generate a new log file
CodeChecker log --build "make" --output compile_commands.json
- Re-analyze the project. Make sure you use the same analyzer options all the time, as changing enabled checkers or fine-tuning the analyzers may result in new bugs being found.
CodeChecker analyze ./compile_commands.json --output ./reports-daily
- Store the analysis results into the central CodeChecher server
CodeChecker store ./reports --url http://localhost:8555/Default \
    --name tmux_master_$(date +"%Y_%m_%d")
This job can run daily and will store the results in different runs identified with the date.
Then you can query newly introduced bugs in the following way.
CodeChecker cmd diff --basename tmux_master_2017_08_28 --newname \
    tmux_master_2017_08_29 --new --url http://localhost:8555/Default
If you would like to generate a report page out of this using a script, you can
get the results in json format too:
CodeChecker cmd diff --basename tmux_master_2017_08_28 --newname \
    tmux_master_2017_08_29 --new --url http://localhost:8555/Default \
    --output json
Note: Don't forget to delete old runs you don't need to save database space.
Please find a Shell Script that can be used in a Jenkins or any other CI engine to report new bugs.
Use CodeChecker in the CI without a server
If you want to use CodeChecker in your project but you don't want to run a CodeChecker server, you can use the following workflow.
This workflow makes it possible to block pull requests which would introduce new faults and to leave the handling of legacy issues to a later time.
These legacy findings can be stored in a text file, instead of the CodeChecker server as in the traditional workflows.
- Analyze your project to a report directory (e.g.:
./reports). For more information see Step 2. - Create a baseline file from the reports which contains the legacy findings:
CodeChecker parse ./reports -e baseline -o reports.baseline. It is recommended to store this baseline file (reports.baseline) in your repository. - On source code changes after your project is re-analyzed use the
CodeChecker diffcommand to get the new reports:CodeChecker cmd diff -b ./reports.baseline -n ./reports --new - On configuration changes (new checkers / options are enabled / disabled, new CodeChecker / clang version is used, etc.) re-generate the baseline file (step 1-2).
Gerrit Integration
The workflow based on Alternative 1) can be used to implement the gerrit integration with CodeChecker. Let us assume you would like to run the CodeChecker analysis to gerrit merge request and mark the new findings in the gerrit review.
You can implement that by creating a jenkins job that monitors the gerrit merge requests, runs the analysis on the changed files and then uploads the new findings to gerrit through its
You can find the details and the example scripts in the Integrate CodeChecker with Gerrit review guide.
Setting up user authentication
You can set up authentication for your server and (web,command line) clients as described in the Authentication Guide.
Updating CodeChecker to new version
If a new CodeChecker release is available it might be possible that there are
some database changes compared to the previous release. If you run into
database migration warnings during the server start please check our
database schema upgrade guide's
Database upgrade for running servers section.
Unique Report Identifier (RI)
Each report has a unique (hash) identifier generated from checker name and the location of the finding: column number, textual content of the line, enclosing scope of the bug location (function signature, class, namespace).
You can find more information how these hashes are calculated here.
Listing and Counting Reports
See a more detailed description in the analyzer report identification documentation.
How reports are counted?
You can list analysis reports in two ways:
- Using the
CodeChecker parsecommand. - Reports view of the Web UI.
Both of them do deduplication: it will not show the same bug report multiple times even if the analyzer found it multiple times.
You may find the same bug report multiple times for two reasons:
- The same source file is analyzed multiple times
(because the
compile_commmands.jsoncontains the build command multiple times) then the same findings will be listed multiple times. - All findings that are found in headers will be shown as many times as many source file include that header.
Example:
//lib.h:
inline int div_h(){int *p; *p=4;};
inline int my_div(int);
//lib.c:
#include "lib.h"
int my_div(int b){
  return 1/b;
}
//a.c:
#include "lib.h"
int f(){
  return my_div(0);
}
//b.c:
#include "lib.h"
int h(){
  return my_div(0);
}
Calling CodeChecker check --ctu -b "g++ -c ./a.c ./b.c lib.c" --print-steps
shows:
[2018-03-22 10:52] - ----=================----
[HIGH] lib.h:1:30: Dereference of undefined pointer value [core.NullDereference]
inline int div_h(){int *p; *p=4;};
                             ^
  Report hash: 6e7a6b71ac1a26751b7a7f7eea80f5da
  Steps:
    1, lib.h:1:20: 'p' declared without an initial value
    2, lib.h:1:30: Dereference of undefined pointer value

Found 1 defect(s) in lib.c

Found no defects in a.c
[HIGH] lib.c:3:11: Division by zero [core.DivideZero]
  return 1/b;
          ^
  Report hash: fbf28fead62aff104c787906defd1169
  Steps:
    1, b.c:3:17: Passing the value 0 via 1st parameter 'b'
    2, b.c:3:10: Calling 'my_div'
    3, lib.c:2:1: Entered call from 'h'
    4, lib.c:3:11: Division by zero

Found 1 defect(s) in b.c

[HIGH] lib.c:3:11: Division by zero [core.DivideZero]
  return 1/b;
          ^
  Report hash: fbf28fead62aff104c787906defd1169
  Steps:
    1, a.c:3:17: Passing the value 0 via 1st parameter 'b'
    2, a.c:3:10: Calling 'my_div'
    3, lib.c:2:1: Entered call from 'f'
    4, lib.c:3:11: Division by zero

Found 1 defect(s) in a.c

Found no defects in b.c
Found no defects in lib.c

----==== Summary ====----
-----------------------
Filename | Report count
-----------------------
lib.h    |            1
lib.c    |            2
-----------------------
These results are printed by doing deduplication and without uniqueing.
As you can see the dereference of undefined pointer value error in the
lib.h is printed only once, even if the header is included from
a.c, b.c, lib.c.
In deduplication mode and without uniqueing (in the Web UI) the reports
in lib.h would be shown only once, as all three findings are identical. So in
total we would see 3 errors: 1 for lib.h and 2 for lib.c.
In uniqueing mode in the Web UI, only 2 distinct reports would be shown:
1 dereference of undefined pointer value for the lib.h and 1
Division by zero for the lib.c.
Report Uniqueing
There is an additional uniqueing functionality in the Web UI that helps the grouping findings that have the same Report Identifier within or across muliple runs. You can enable this functionality by ticking in the "Unique reports" tick box in the Bug Overview tab.
This feature is useful when:
- you want to list unique findings across multiple runs. In this mode the same report stored in different runs is shown only once.
- you want count reports as one which end up in the same same bug location, but reached through different paths. For example the same null pointer deference error may occur on multiple execution paths.
The checker statistics view shows an aggregate count of the reports accross multiple runs. The report counts shown on that page are calculated using the unique report identifiers.
How diffs between runs are calculated?
Report sets in different runs can be compared in order to determine which are
the new, resolved or unresolved reports. A report's type is identified by a
hash value. For example, when a specific bug
appears multiple times in the project or stored to several runs then they get
the same hash. Comparison is based on this hash value. CodeChecker cmd diff
command and the diff column of Runs table in the GUI are comparing the set
of hashes and displaying all of their occurrences unless unique mode is used.
CodeChecker displays the list of outstanding reports, that are potential bugs in the project, so developers need to check it. A report can be non-outstanding for numerous reasons:
- The bug is fixed in the source code.
- The report's detection status is either resolved, off (i.e. the corresponding checker is explicitly turned off) or unavailable (i.e. the checker doesn't exist anymore).
- The report is suppressed by false-positive or intentional marking. Suppression can be done in source code comments and can be set via suppression rules in the GUI.
Suppose that a project is analyzed twice as a baseline and a new-check. These contain the following reports:
Baseline
(analyzed to baseline_reports folder and stored as baseline_run to the server)
--------
report1
report2
         // report3 not found during analysis
report4  // Suppressed in source code
report5
report6  // Suppressed in source code
report7  // Suppression rule set in GUI

New-check
(analyzed to newcheck_reports folder and stored as newcheck_run to the server)
---------
report1
         // report2 not found during analysis
report3
report4
report5  // Suppressed in source code
report6  // Suppressed in source code
report7  // Suppression rule set in GUI
The result comparison commands produce the following results when
baseline_reports and newcheck_reports directories are compared. Note that
in this case there is no communication towards CodeChecker server. Since the
server may carry further information about suppressions, the results may differ
when a remotely stored run is involved in comparison. We will discuss this case
later.
# Comparing two report directories.

# All reports that have report hash not present in baseline and which are present in newcheck.
CodeChecker cmd diff -b baseline_reports -n newcheck_reports --new
report3  # Not existing in baseline, introduced in new-check.
report4  # Not outstanding in baseline, because suppressed.

# All reports that have report hash not present in newcheck and which are present in baseline.
CodeChecker cmd diff -b baseline_reports -n newcheck_reports --resolved
report2  # Has been fixed in new-check.
report5  # Has been suppressed in new-check.

# All reports that have report hash both in baseline and newcheck.
CodeChecker cmd diff -b baseline_reports -n newcheck_reports --unresolved
report1  # Still in new-check.
report7  # Suppressed in GUI, but report directories don't check remote stores.
When either baseline or new-check is a remotely stored run, then suppression rules set in GUI are taken into account. The results are the same as in the comparison of two local report directories, except for unresolved reports. In this case it is assumed that the user's intention was to manage suppressions via GUI, so a report is considered suppressed even if it's found in a local report directory but suppressed via GUI.
# Comparing a report directory to a remote run (or in reverse).

CodeChecker cmd diff -b baseline_run -n newcheck_reports --unresolved
report1  # Still in new-check.
         # report7 not shown.